






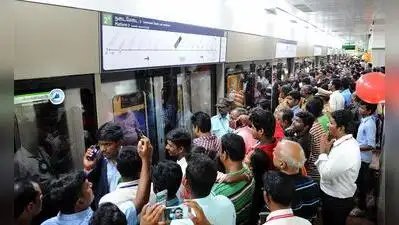
Chennai: Metro commuters could get better last-mile connectivity, with Chennai Unified Metropolitan Transport Authority (Cumta) set to map passengers before and after getting off the train, using anonymised mobile phone location data.The exercise is aimed at identifying gaps in feeder connectivity and planning routes based on actual travel patterns. Cumta has invited tenders for a two-month study to prepare origin-destination (OD) matrices for the catchment areas of all 41 operational Phase I stations of Chennai Metro Rail Limited (CMRL).Cumta, along with MTC, has identified 12 metro stations to introduce last-mile connectivity on a pilot basis — 150 5m buses and 70 7m buses by mid next year. They will operate within a 5km radius of the stations, with fares expected to be around ₹20-25.“But we need to plan their routes. Apart from serving existing commuters, we need new ones to opt for public transport. So planning is needed to take metro to doorsteps,” said I Jeyakumar, member secretary, Cumta.The study will map an area extending up to 5km by road around each station and divide it into small traffic analysis zones of about 0.5sqkm, to examine travel patterns at a more local level. The consultant will use anonymised GPS traces from smartphone applications or mobile networks covering a minimum three-month period. “We have specified that the data sample should represent around 10-15% of the target population,” said a Cumta official. The data will be processed to identify trips, their origins and destinations, peak and off-peak movements and trip lengths. The study will compare overall travel demand in these areas with actual CMRL ridership. “We want to understand the share of trips being captured by CMRL and the travel demand that exists around stations but may not be translating into metro trips,” the official added.CMRL’s Phase I network covers 54km with 41 stations on the blue and green lines, carrying more than 3.5 lakh passengers a day. Cumta plans to provide a web-based platform for one year, with heat maps and desire-line diagrams showing travel movements across the study area.